
+95% sales in 30 days for an Egyptian footwear store
We fixed the whole store — not just the ads — and sales, orders and conversion rose together.
- Client
- Egyptian footwear store (name withheld)
- Platform
- Shopify — about 2,300 products
- Services
- UX, SEO, offers, shipping, Meta Ads
- Period
- Aug – Oct 2026
- Sales
- EGP 1,546,850
- ↗ 95%
- Orders
- 997
- ↗ 126%
- Items sold
- 1,425
- ↗ 150%
- Store visits
- 38,802
- ↗ 52%
- Conversion rate
- 1.99%
- ↗ 82%
- Delivery success
- 60% → 79%
- +19 points
Shopify, Sep 5 – Oct 5, 2026 vs. Aug 5 – Sep 4, 2026. Client name withheld for confidentiality.
An Egyptian online footwear store
A Shopify store selling men's and women's shoes, with about 2,300 products listed. The brand name, website and campaign names are confidential, and every screenshot here has identifying details hidden.
Good products. Hard to buy.
- Hard-to-use website — Messy categories and a long checkout. Conversion rate was about 1.1%.
- Only 60% of orders delivered — Four in ten orders never reached the customer.
- A flat 15% discount on everything — It cut margins without giving customers a reason to buy more.
- Heavy reliance on paid ads — Most sales came from paid social campaigns.
- Products blocked on Google — Most products were not approved or limited in Google Merchant Center from late July to mid-August.
Five steps across the whole store
A store that's easy to buy from (UI/UX)
- Rebuilt the website structure and categories
- Made checkout shorter and simpler
- Sorted products by stock, so available items show first
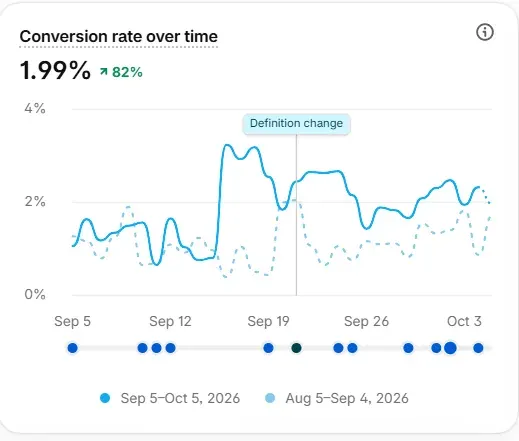
Result: 1.1% → 1.99% Conversion rate, up 82% in the last 30 days
Content that sells on Google
- SEO descriptions for the most-searched products
- A product video on every product page
- A new YouTube channel for the brand
- Google Merchant Center issues fixed — products approved from Aug 19, 2026
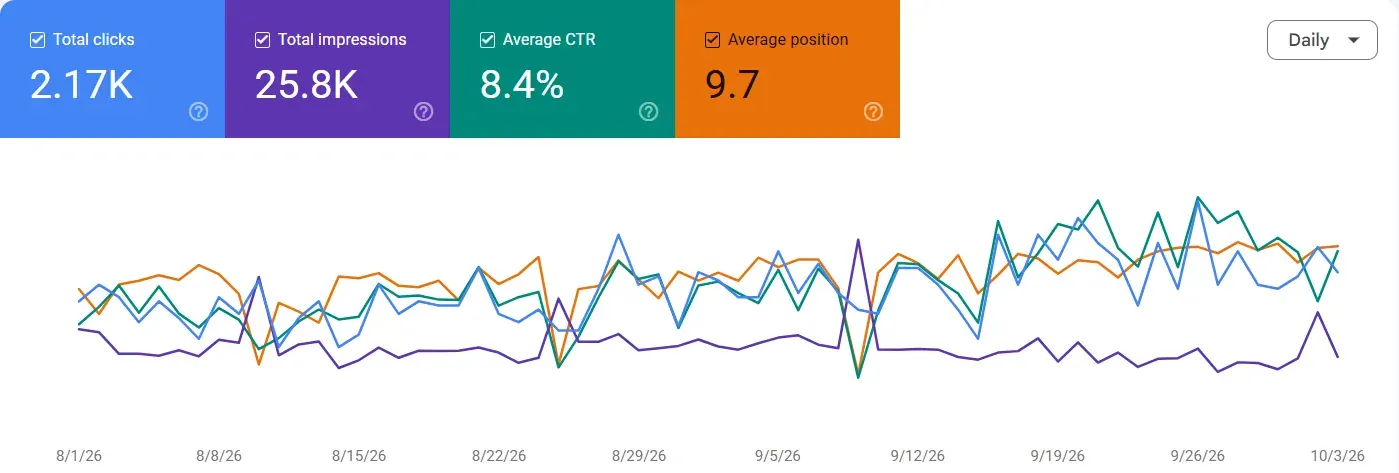
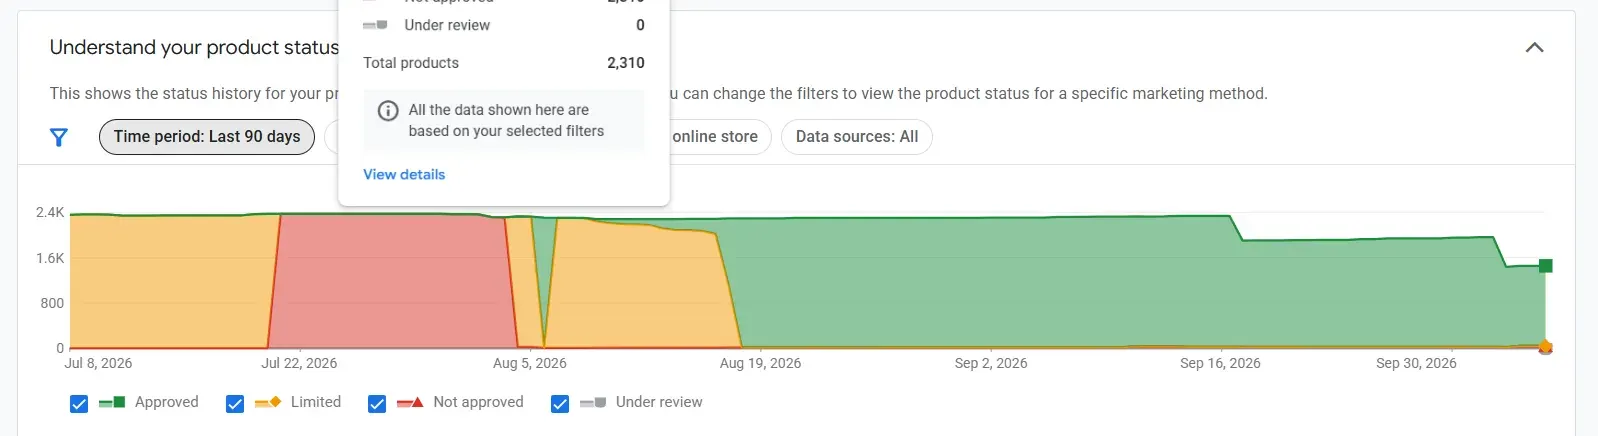
Result: 2.17K clicks From Google Search in 3 months. Google visitors buy at 1.93% vs. 1.31% from ads.
Smarter offers, bigger orders
- Before
- 15% off everything
- After
- 10% off 1st item + 30% off 2nd
- Plus
- Instalments in 3, 4 or 5 payments
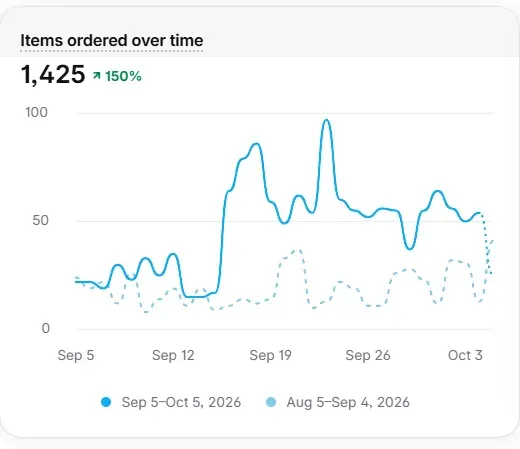
Result: +150% Items sold. Items per order: 1.29 → 1.43
Customers who bring new customers
Order delivered → Review + photo → 10% off next order
More real photo reviews build trust with new buyers, and bring customers back for repeat orders.
Delivery that doesn't lose sales
- Tracked the reason behind every failed delivery
- Switched to a new shipping partner that fixed them
Result: 60% → 79% Delivery success rate, +19 points
A better store made every ad work harder
Weekly ROAS rose from about 5x in early August to about 13x by late September. End-of-summer offers were planned weeks ahead and launched in mid-September.
- ROAS
- 8.81x
- 30 days
- Purchases
- 563
- from ads
- Cost per purchase
- EGP 213
- Purchase value
- EGP 1.06M
- on EGP 119,921 spend
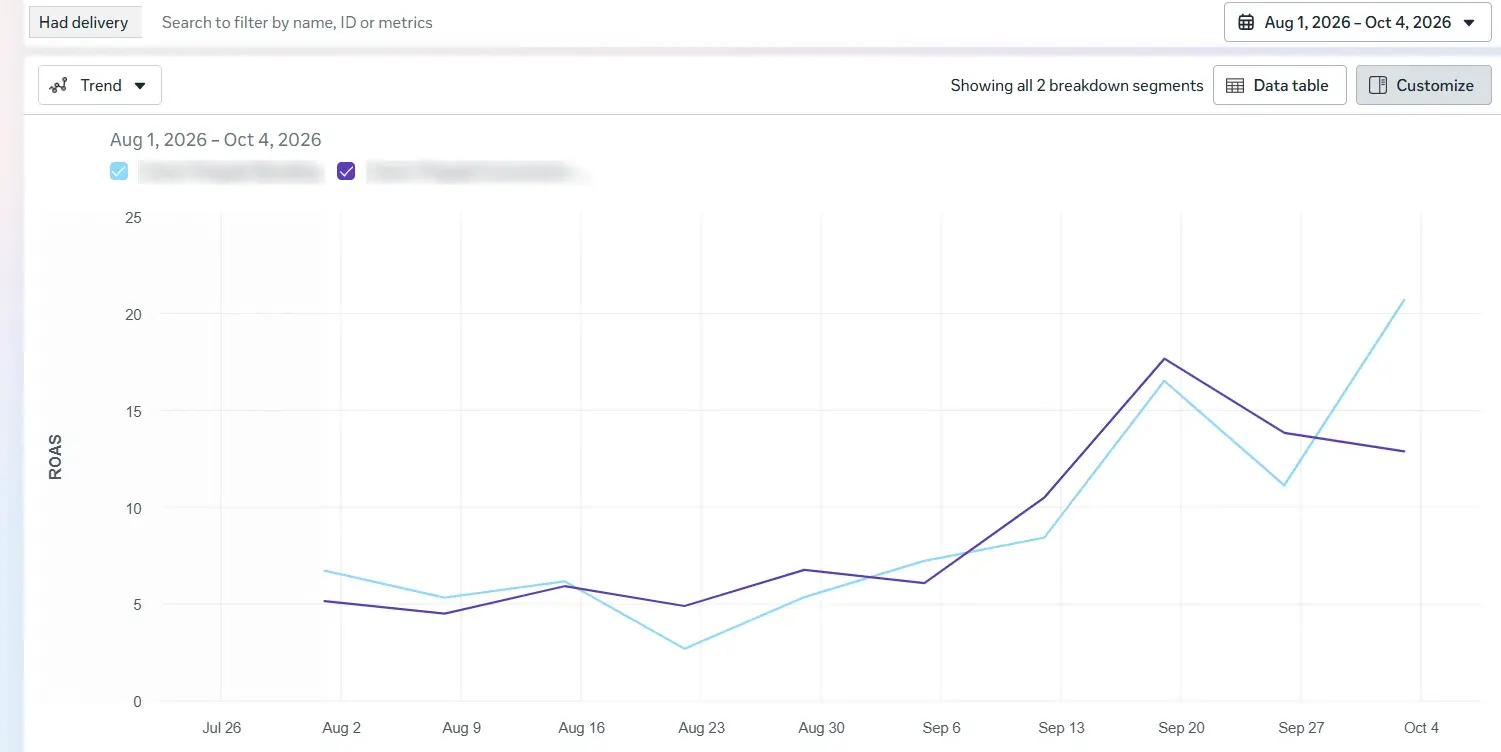
Meta Ads Manager, Aug 25 – Sep 23, 2026. Meta uses its own attribution, so its figures overlap with other channels.
The 60-day view: Aug 1 – Sep 30, 2026 vs. Jun 1 – Jul 31
- Sales
- EGP 2.24M
- ↗ 20%
- Orders
- 1,352
- ↗ 28%
- Items sold
- 1,883
- ↗ 41%
- Conversion
- 1.55%
- ↗ 38%
September sales: EGP 1,426,553, up 76% on August. About 30% of tracked revenue came from channels with no ad spend.
Fix the store first. Then let ads and offers do more.
- Store before budget — Better UX and delivery made every visit and every order worth more.
- Designed offers — A second-item deal and instalments made bigger orders easy.
- Free channels too — SEO, video, YouTube and Merchant Center bring buyers with no ad spend.
- Planned timing — Offers launched on a date set weeks ahead, with stock ready.
We fixed the store first, then let ads and offers work harder.
Next: Q4 2026
Google Ads
Search and shopping campaigns on keywords SEO has shown to sell.
Email campaigns
Regular campaigns to the customer base for repeat orders.
Winter season
Winter stock and offers, planned from end-of-summer results.
The services behind this result
Conversion rate optimisation
Turn more of your visitors into buyers.
DetailsSEO
Lasting Google visibility with no cost per click.
DetailsMeta Ads
Facebook & Instagram campaigns built around sales.
DetailsStore operations
We run your store daily: products, orders, stock.
DetailsContent & video production
Photos, videos and reels that show and sell.
DetailsWant a growth plan for your store this Q4?
Our team will reach out with a plan built on your store's numbers. For stores making EGP 50K+ a month.
- No commitment
- Written plan
- Reply within one business day